Stem and Leaf Plots
|
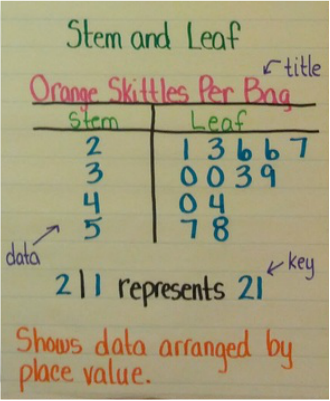
VocabularyA stem and leaf plot shows data arranged by place value. Each data value is split into a "leaf" (usually the last digit) and a "stem" (the other digits). For example "32" is split into "3" (stem) and "2" (leaf). The "stem" values are listed down, and the "leaf" values are listed next to them.
NotesIn the sample stem and leaf plot we can see that there was one bag of Skittles that had 21 orange, 1 bag of Skittles that had 23 orange, 2 bags of Skittles that had 26 orange and so on.
STAAR Released Sample Questions
|
