Frequency Tables
|
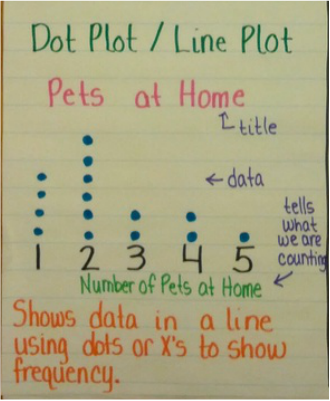
VocabularyA dot plot is a type of graphic display used to compare frequency counts within categories or groups. As you might guess, a dot plot is made up of dots plotted on a graph.
NotesIn the sample dot plot, we can see that there are 4 students that have one pet at home, 6 students that have 2 pets at home and so on. The dots represent the people that were surveyed and the numbers along the bottom of the plot tell what we are counting.
STAAR Released Sample Questions
|
